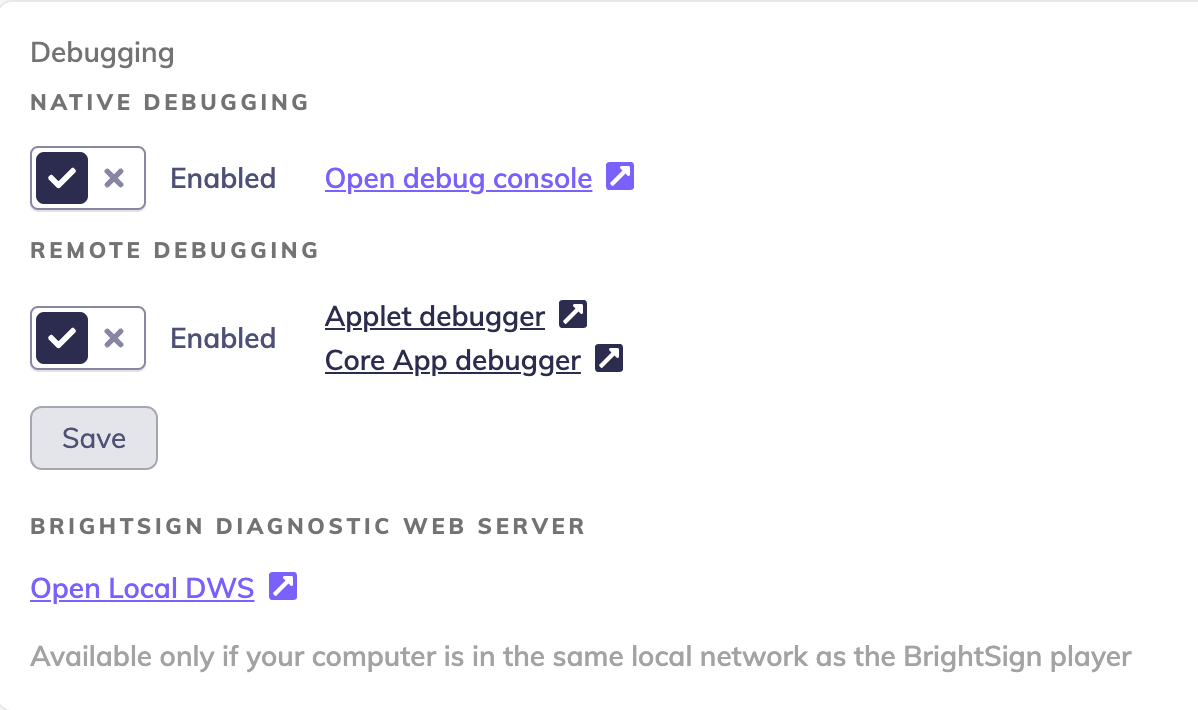
BrightSign Native Debug
danger
NOTE: Enabling native debug on Brightsign devices causes memory issues and may lead to out of memory errors, make sure that Native debug is turned off once your debugging session is finished
Quick access to Diagnostic Web Server
For BrightSign devices, you can access the debug console and the Diagnostic Web Server directly from Box. Navigate to the Troubleshooting tab on device detail, enable Native debug and select one of the following options:
- Open debug console (to debug your application in Chrome debugger)
- Open Local DWS (to access BrightSign's built-in troubleshooting menu)
Debugging Chromium on BrightSign OS 9.1 and newer
- Open BrightSign device detail in Box
- Navigate to Troubleshooting Tab
- Click "Native Debug"
- Reboot display
Once HTML content is running on a BrightSign player, follow these steps to inspect it:
- Open Chrome on a desktop computer connected to the same local network.
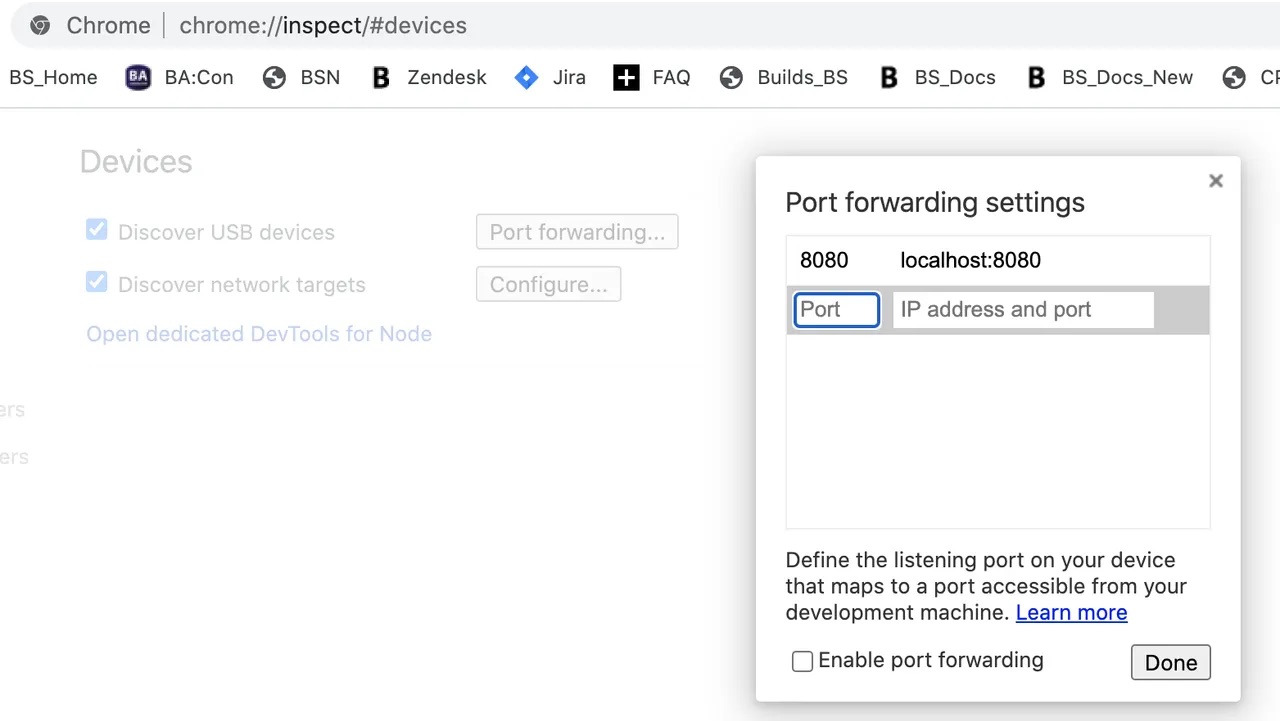
- Enter the following URL into the address bar: chrome://inspect/devices
- In the Devices section, click Configure.
- Enter the player IP address and Web Inspector port in the field (see the image below). The page(s) being run on the BrightSign player will be displayed at the bottom of the page.
- If you don't know the player IP address, look it up in on the device detail OR power on the player with the microSD card (and other storage devices) removed. After a few moments, the IP address will be displayed on screen.
- If you enabled the Native debug in Box, use port 2999 (e.g. http://192.168.1.62:2999/).
- Click the Inspect button next to a page. A debugging session will be launched in a new window. Unlike local pages, the page contents are not displayed in the left pane, but the inspector window on the right can be used to debug the page.
Debugging Chromium on BrightSign OS 8.5 and 9.0
Prerequisites
- Install older Chromium (here are some available)
Step-by-Step Guide
To debug the BrightSign display, follow the steps below:
- Open BrightSign device detail in Box
- Navigate to Troubleshooting Tab
- Click "Native Debug"
- Reboot display
- Open older Chromium
- In Chromium open
http://IP-OF-THE-BRIGHTSIGN:3000URL - Chrome inspector will show up
- Debug
warning
If you are not allowed to open the native debug URL in the latest Chrome, launch the Chrome with the following command/flag chromium-browser --enable-blink-features=ShadowDOMV0,CustomElementsV0