LG webOS Native Debug
Prerequisites
- Install older Chromium (here are some available)
Step by Step Guide
In order to debug the LG webOS display, follow the steps below:
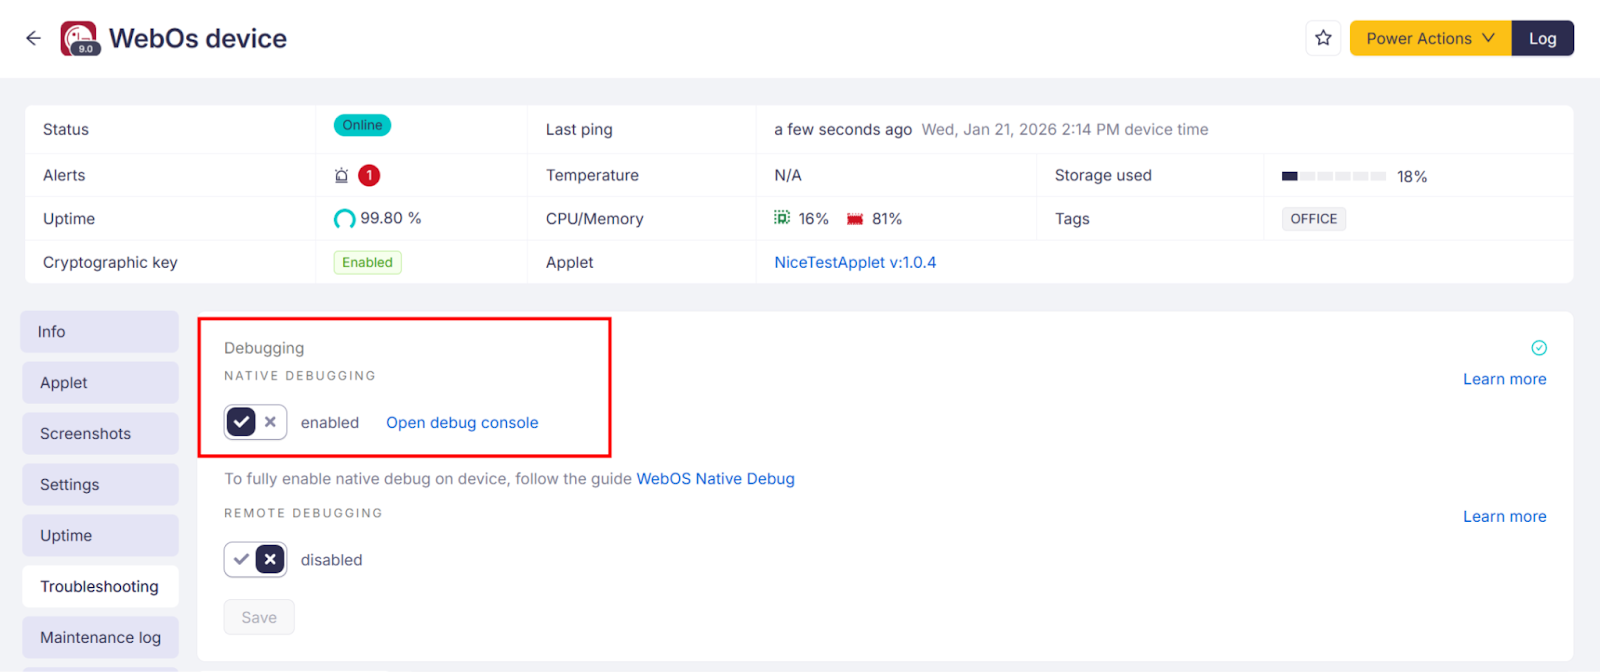
- Open LG webOS device detail in Box
- Navigate to Troubleshooting Tab
- Click "Native Debug"
- Display will be rebooted (or alternatively reboot manually)
Then follow the guide based on your display generation:
webOS 1.0-4.1
- Open older Chromium
- In Chromium open
http://IP-OF-THE-DISPLAY:9998URL - Chrome inspector will show up
- Debug
webOS 6.0 and above
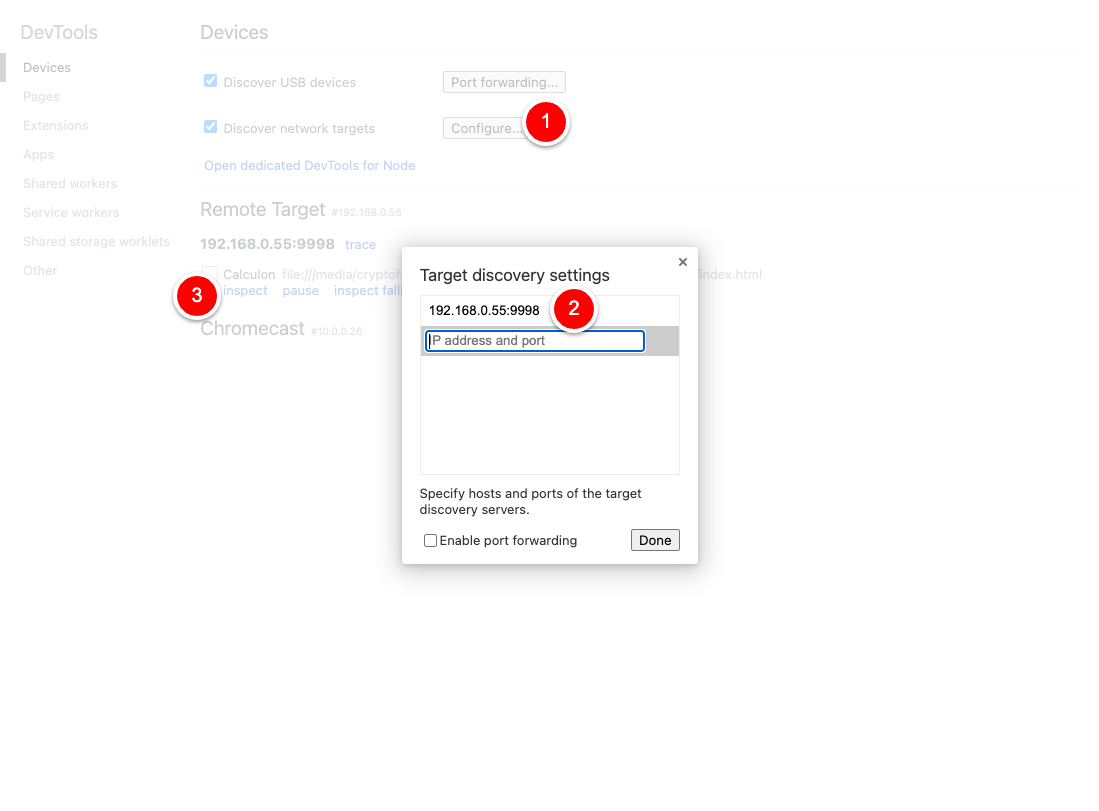
- Open chrome://inspect
- Click Configure and add a new record with IP_OF_YOUR_WEBOS:9998
- Confirm
- See new device to show up on the inspect page
- Click
inspect
Switching Native Debug Mode (inspect)
Chrome DevTools remote debugging is only available if the Core App is installed with inspectable: true
By default, production builds are not inspectable. To enable inspectable native debugging, signageOS will automatically re-install the application with appropriate debug version.
Behaviour in signageOS platform
When toggling the Native Debug mode a debug version will be installed/uninstalled.
Enable Native debug
-> The device automatically downloads and installs a debug version of the application.
Disabling Native Debug
-> The device reverts back to the production version of the application.
Note: By clicking Open debug console a new tab will open and you can now use Chrome DevTools to inspect the device without the need for chrome://inspect or adding IP manually as in previous methods.
Troubleshooting
In case you won't be able to run the debugging session, make sure that URL with the ip address and port doesn't contain the https protocol. It may block the debugging site. Use only HTTP for the debugging session.
If you are not allowed to open native debug URL in the latest Chrome, launch the Chrome with the following command/flag chromium-browser --enable-blink-features=ShadowDOMV0,CustomElementsV0